

Sahel 2026: A Growing Footprint in a Competitive D/OOH Market
Egypt’s North Coast outdoor advertising market expanded during summer 2026, as campaign values increased, more advertisers participated and activity spread across the roads approaching the Mediterranean. Real estate remained dominant, while hospitality gained ground and digital screens appeared in more campaigns.
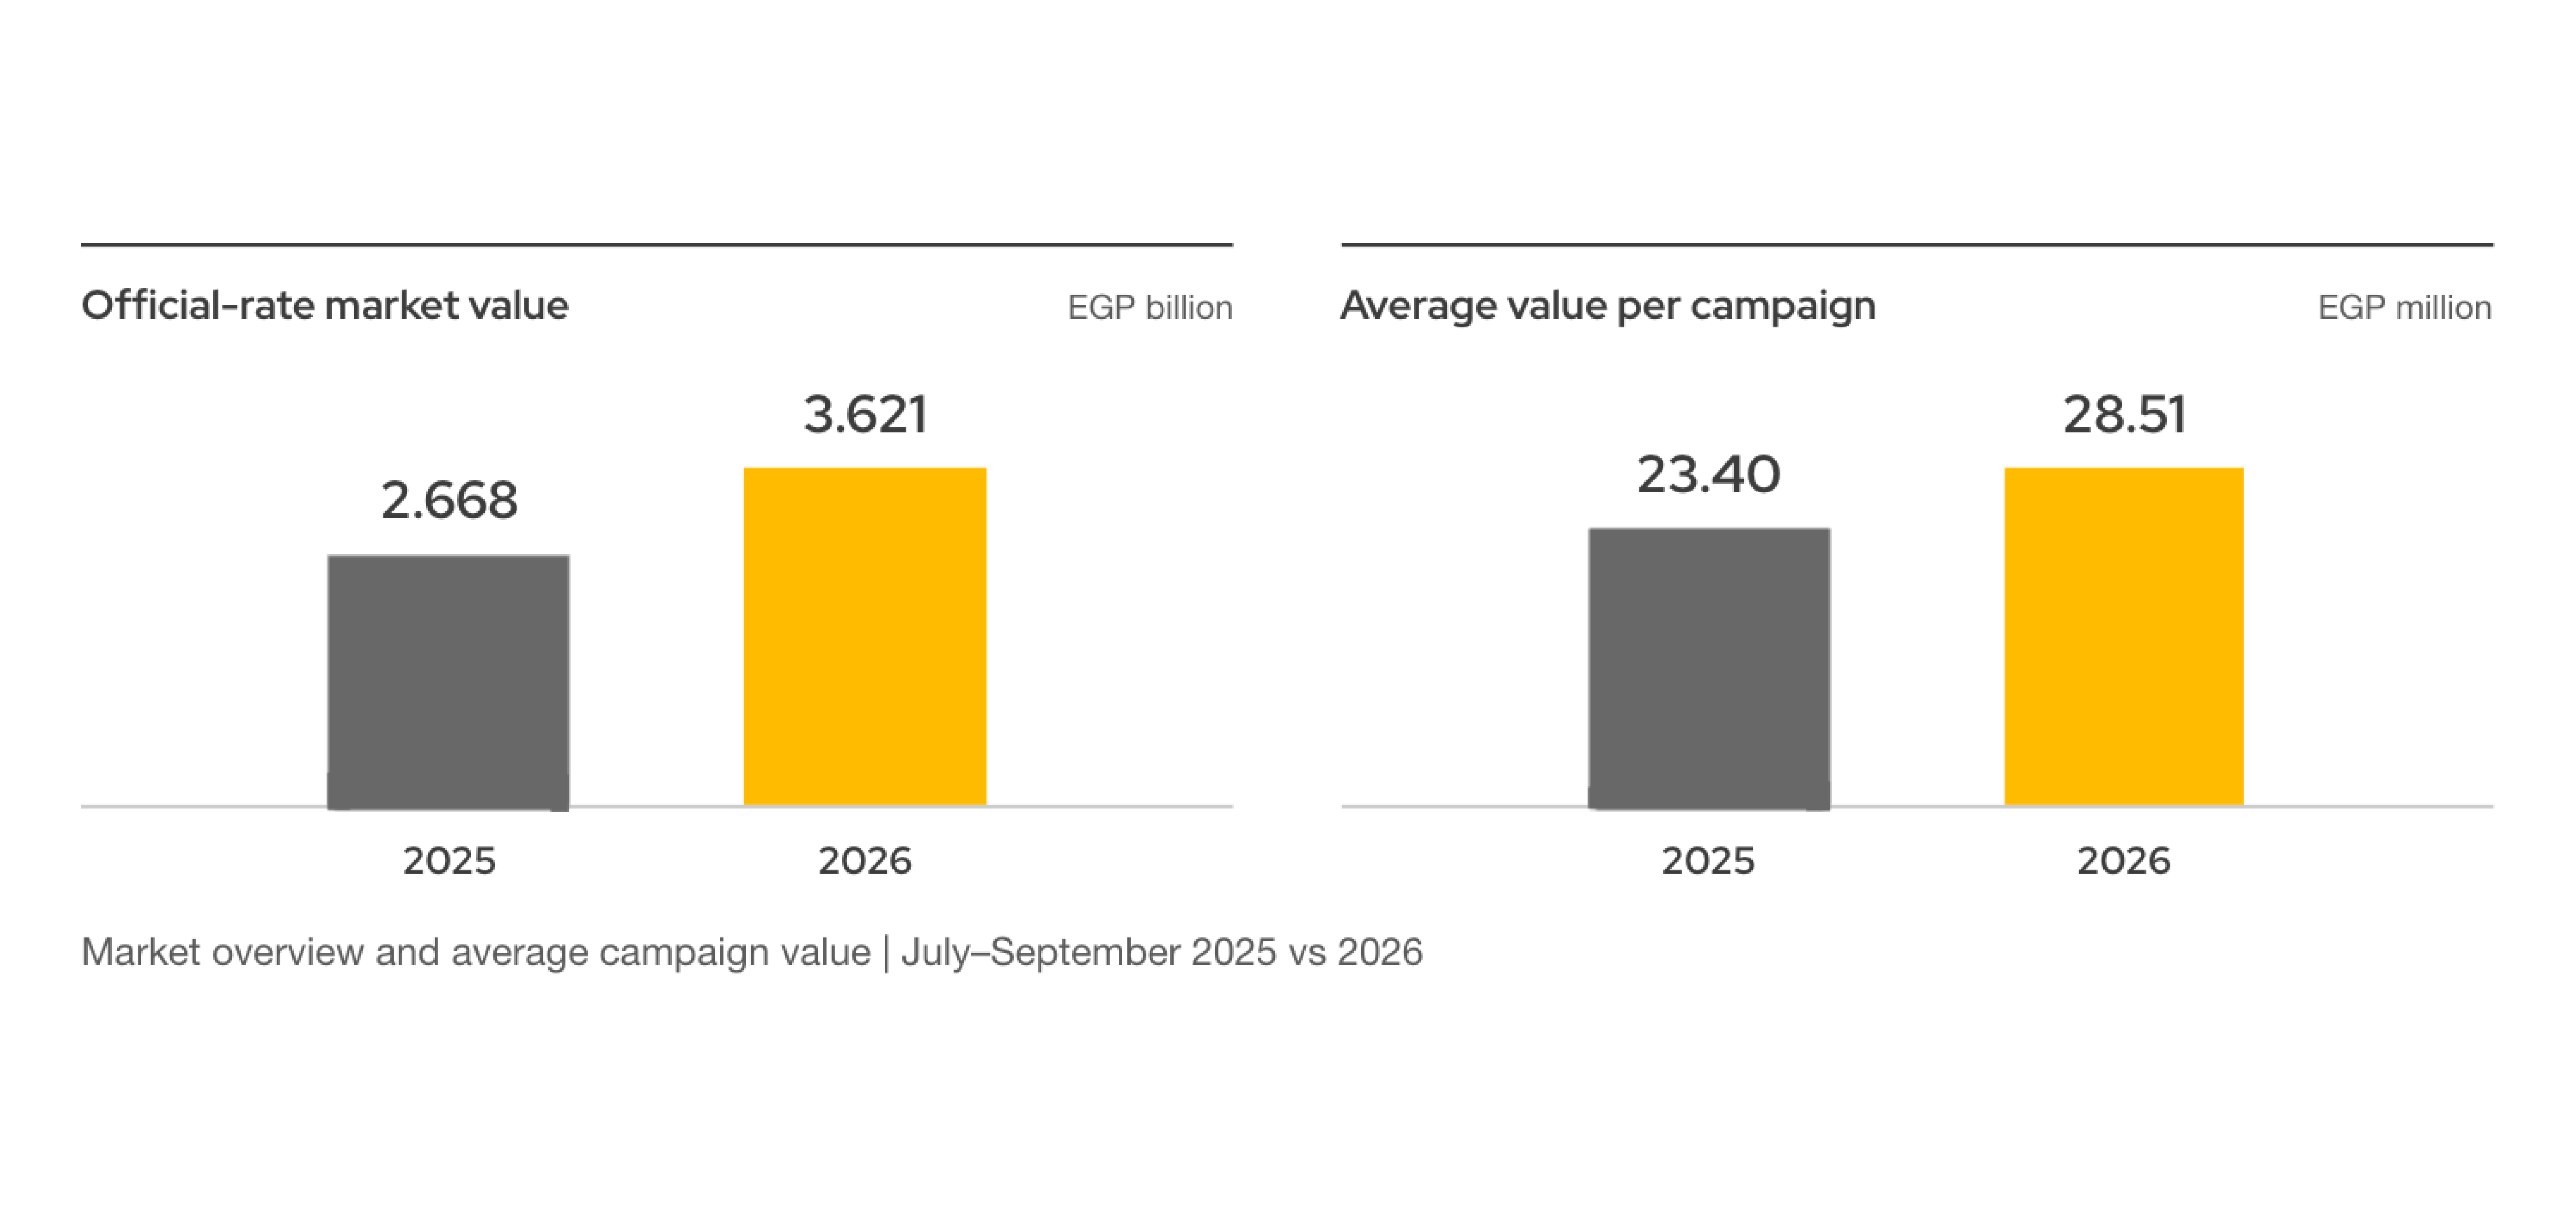
MOOH Media Intelligence recorded EGP 3.621 billion in official-rate advertising value between July and September, up 35.7% from EGP 2.668 billion in 2025. Monitoring covered 445 km across defined Cairo–Alexandria, Wadi El Natrun–Alamein and International Coastal road segments.
The season featured 127 campaigns from 94 advertisers representing 114 brands, compared with 114 campaigns, 81 advertisers and 97 brands previously. These represent increases of 11.4%, 16.0% and 17.5%, respectively.
Campaign Value Outpaces Campaign Growth
Average official-rate value per campaign increased 21.9%, from EGP 23.40 million to EGP 28.51 million. Higher campaign valuations therefore contributed to growth alongside broader participation.
Face-use records rose 38.5%, from 8,397 to 11,629, while average records per campaign increased from 73.7 to 91.6. Market value growth broadly tracked this expansion in recorded activity.
These records count advertising faces within campaigns and monitoring months. The same physical face can appear repeatedly, so totals do not represent unique inventory or audience reach.
Real Estate Leads, Hospitality Gains
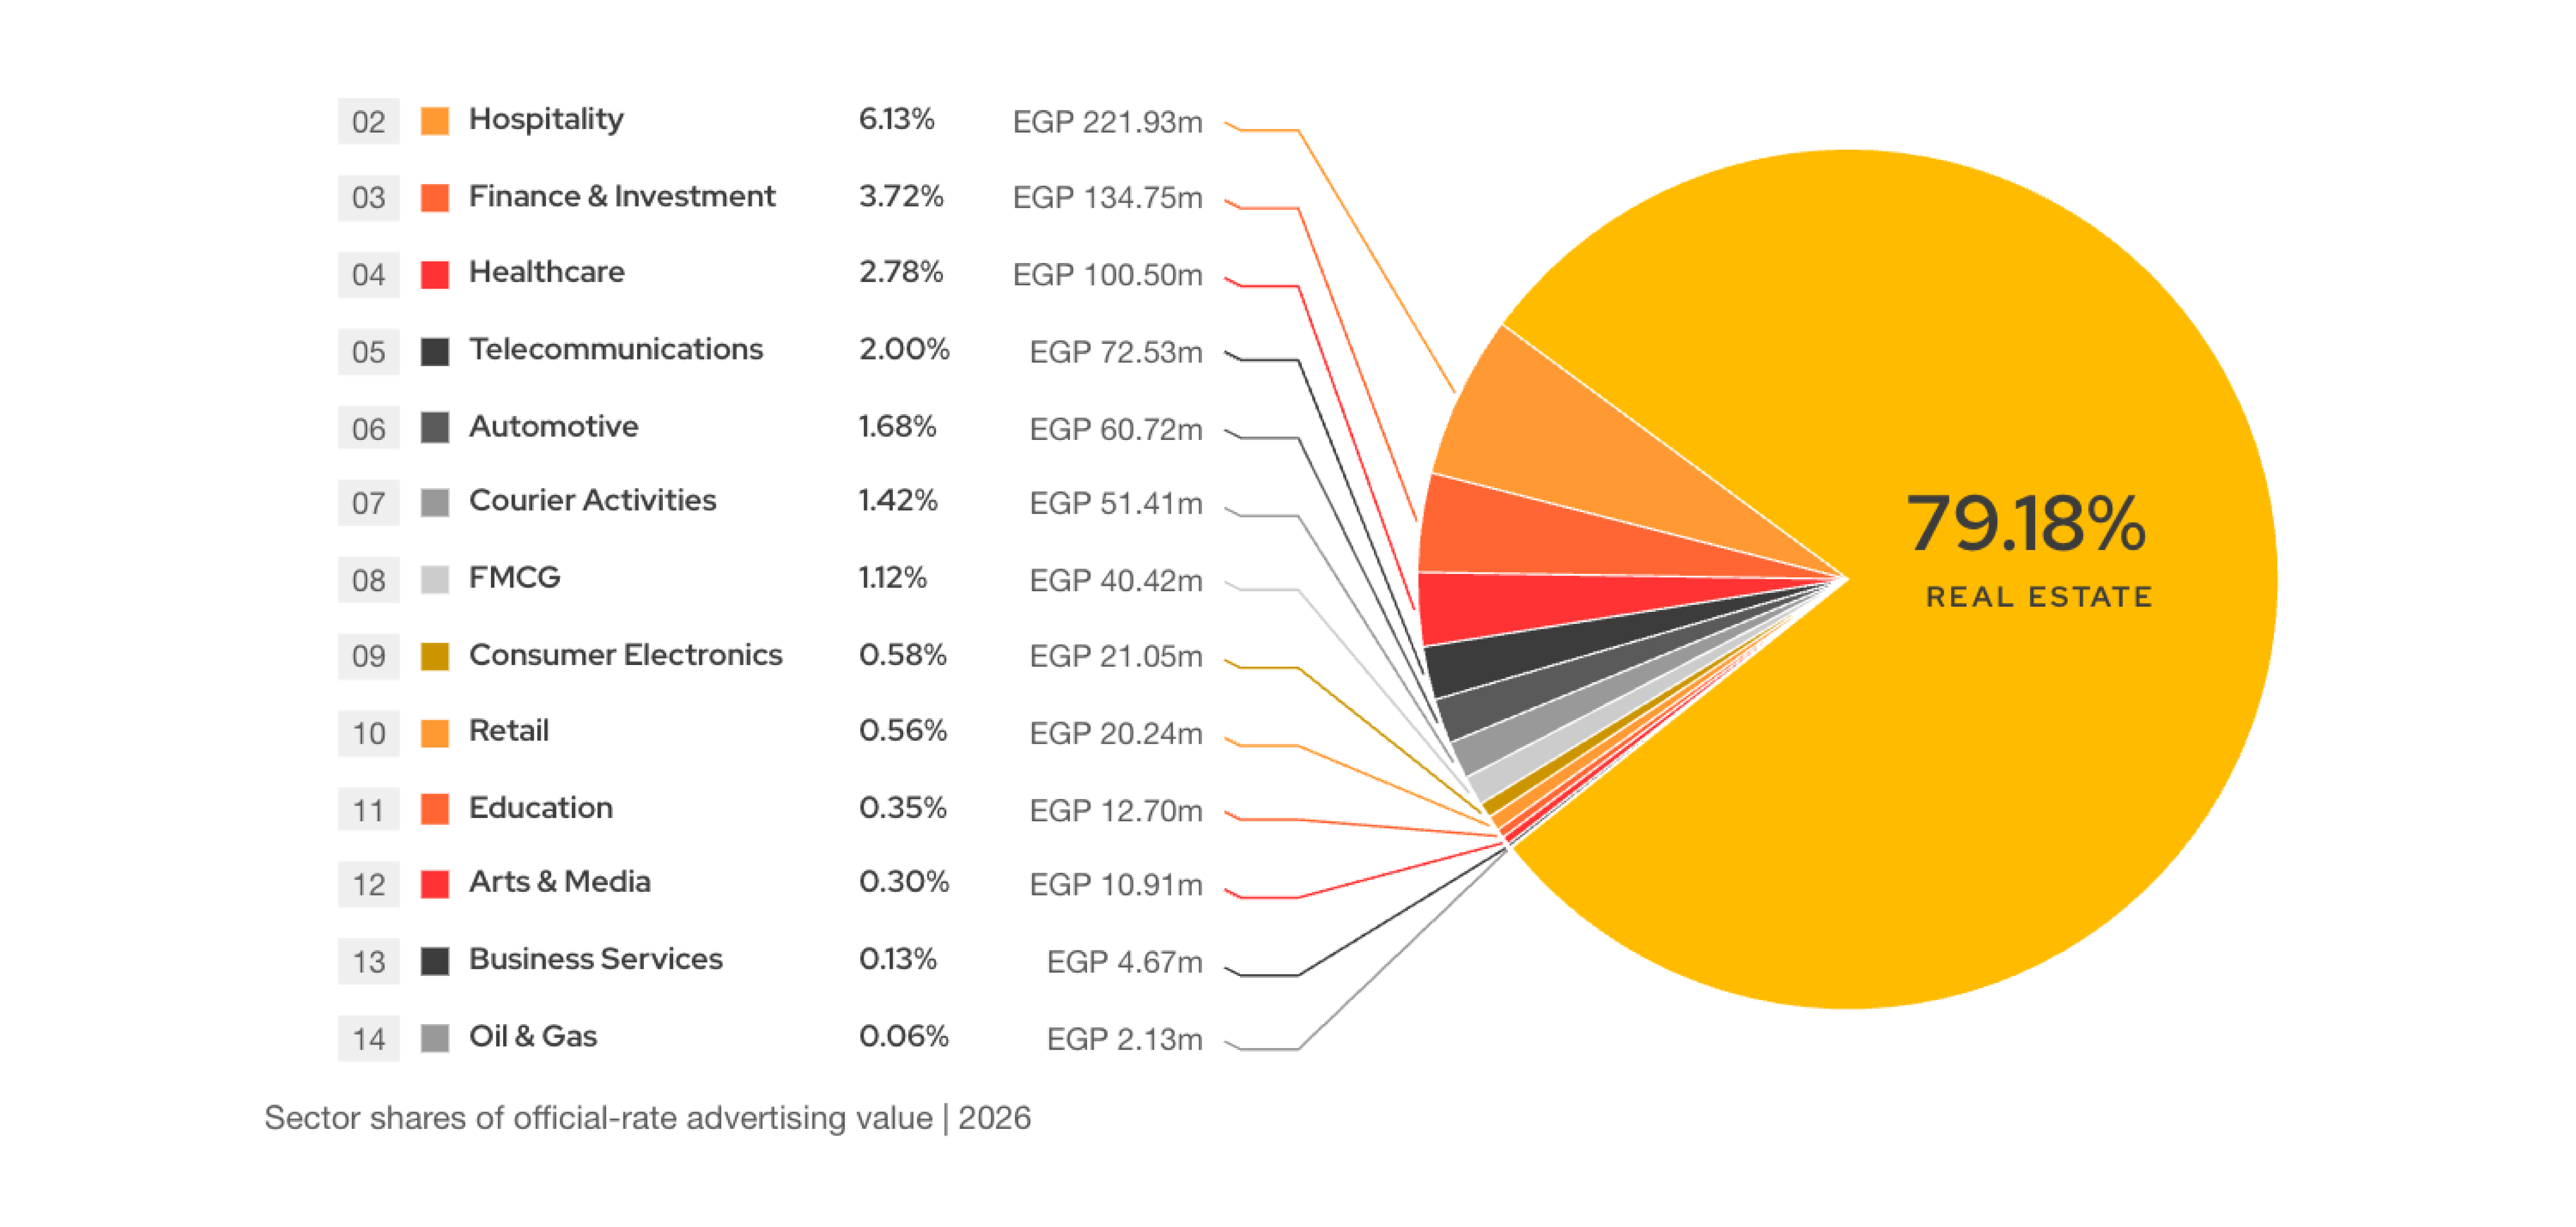
Real estate generated EGP 2.867 billion, growing 33.7% and contributing approximately EGP 723 million, or 75.8%, of the market’s net increase. Its share nevertheless eased from 80.37% to 79.18%, as other sectors collectively grew 44.0% to approximately EGP 754 million.
Hospitality overtook Finance & Investment to rank second, reaching EGP 221.93 million after 86.8% growth. Its share stood at 6.13%. Finance & Investment declined 21.7% to EGP 134.75 million, representing 3.72%.
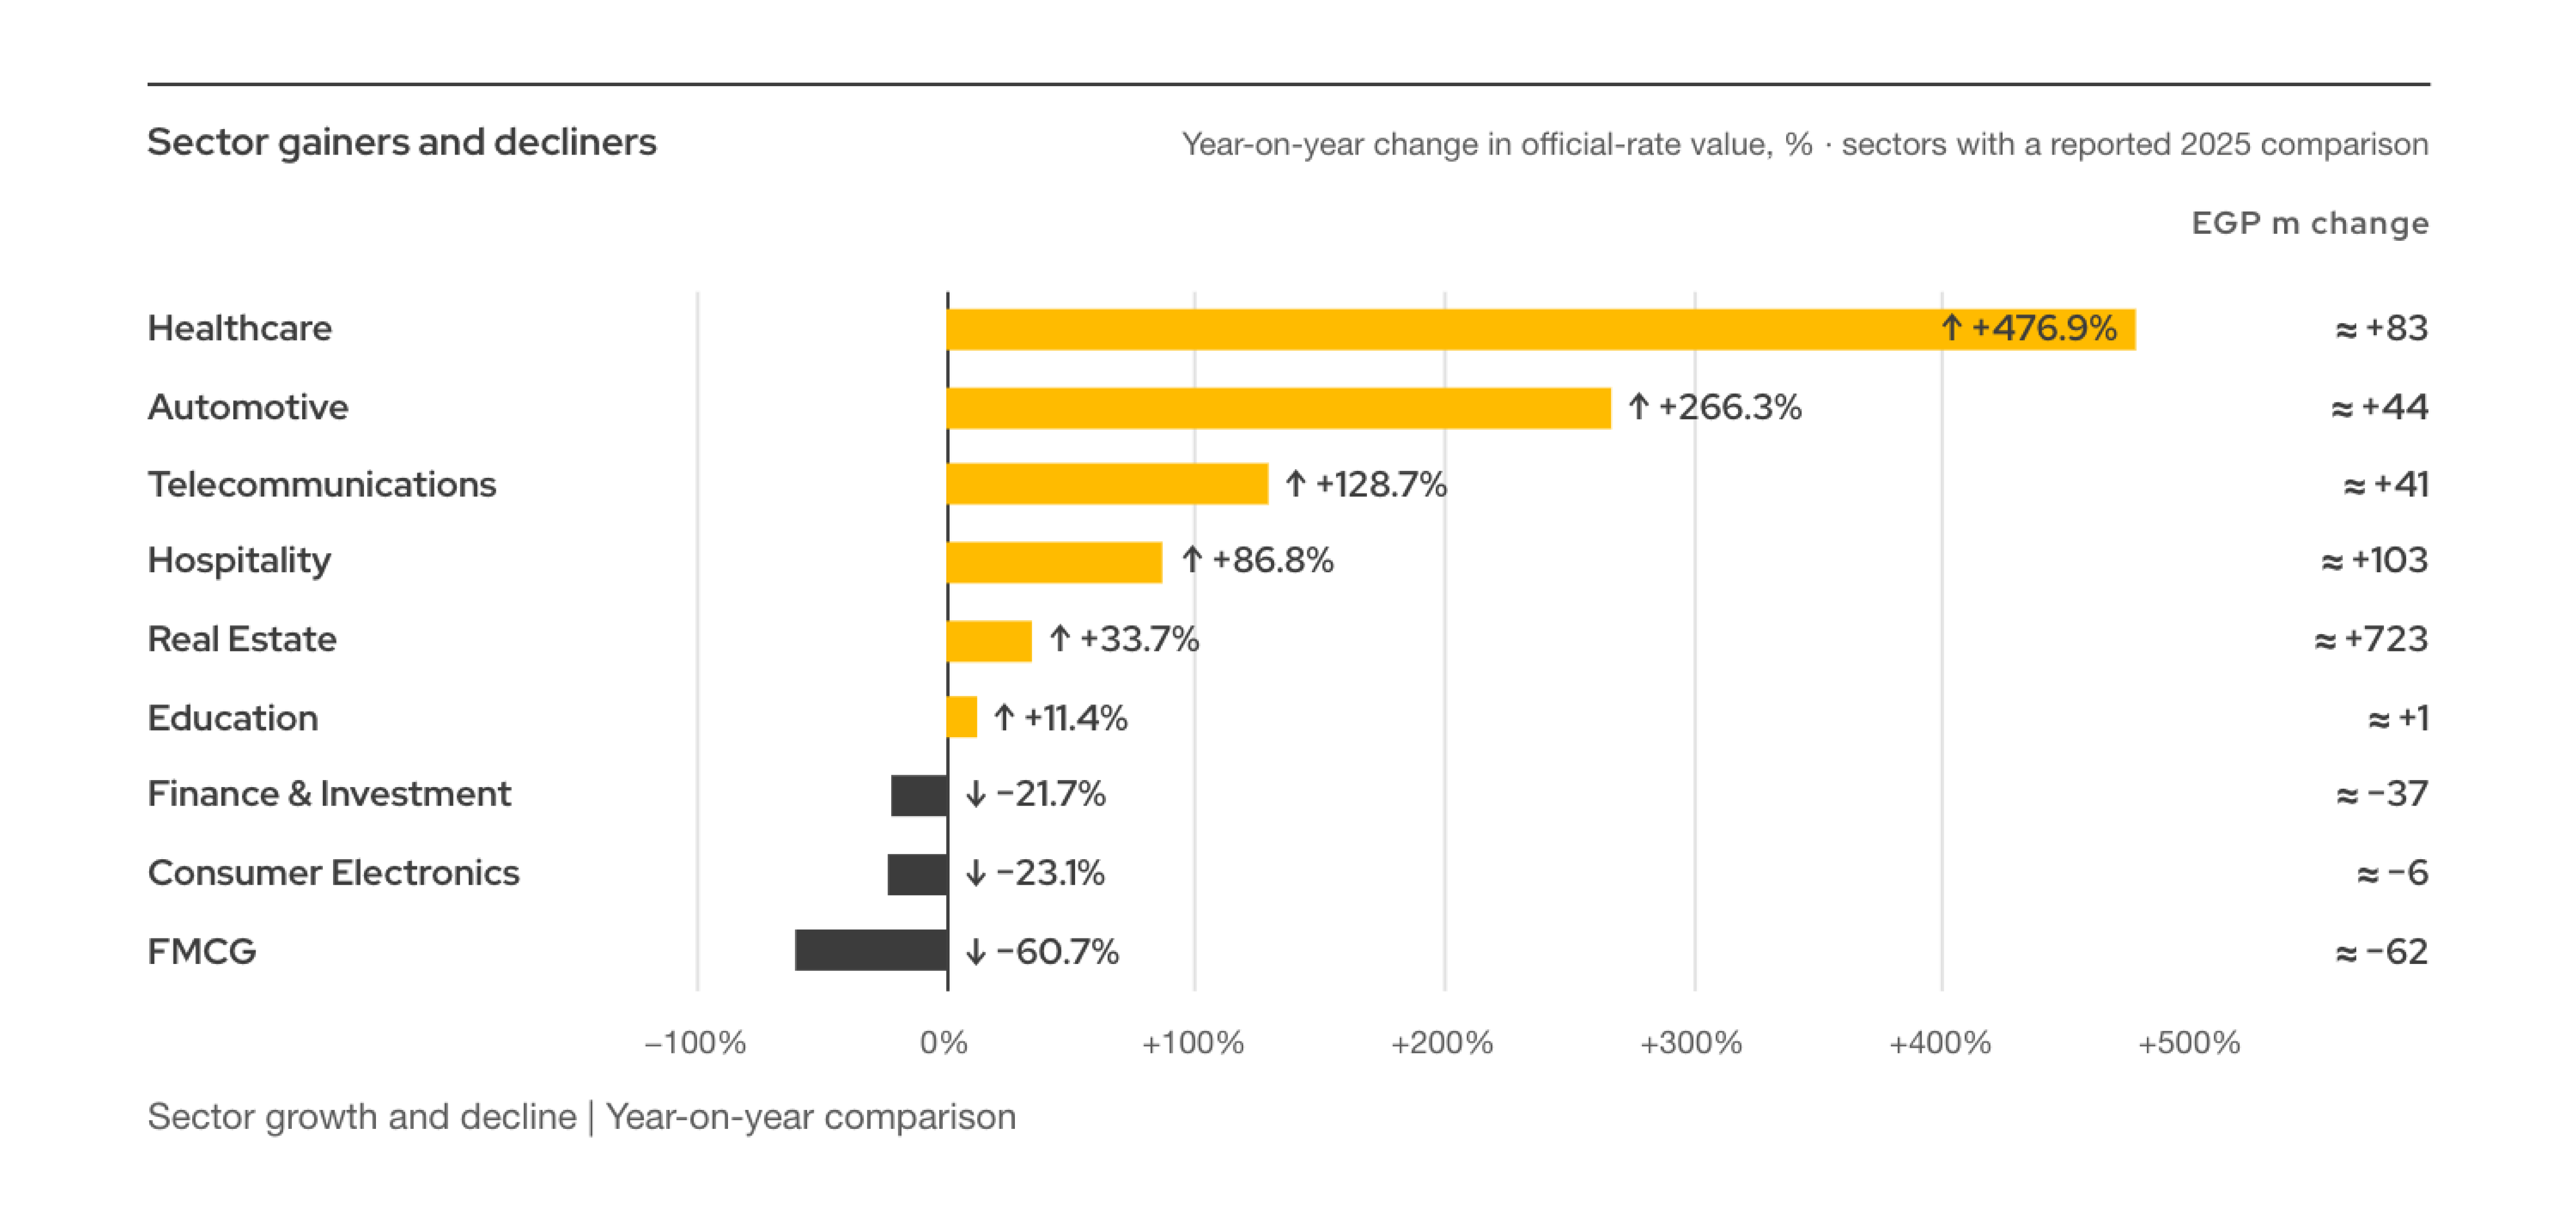
Healthcare increased 476.9% to EGP 100.50 million, the fastest reported sector growth. Telecommunications rose 128.7% to EGP 72.53 million, while Automotive grew 266.3% to EGP 60.72 million. Their shares remained comparatively modest at 2.78%, 2.00% and 1.68%.
Courier Activities recorded EGP 51.41 million. FMCG fell 60.7% to EGP 40.42 million, moving from fourth to eighth place. Consumer Electronics declined 23.1% to EGP 21.05 million. Retail, Education, Arts & Media, Business Services and Oil & Gas completed the sector distribution.
Leading Advertisers Concentrate Market Value
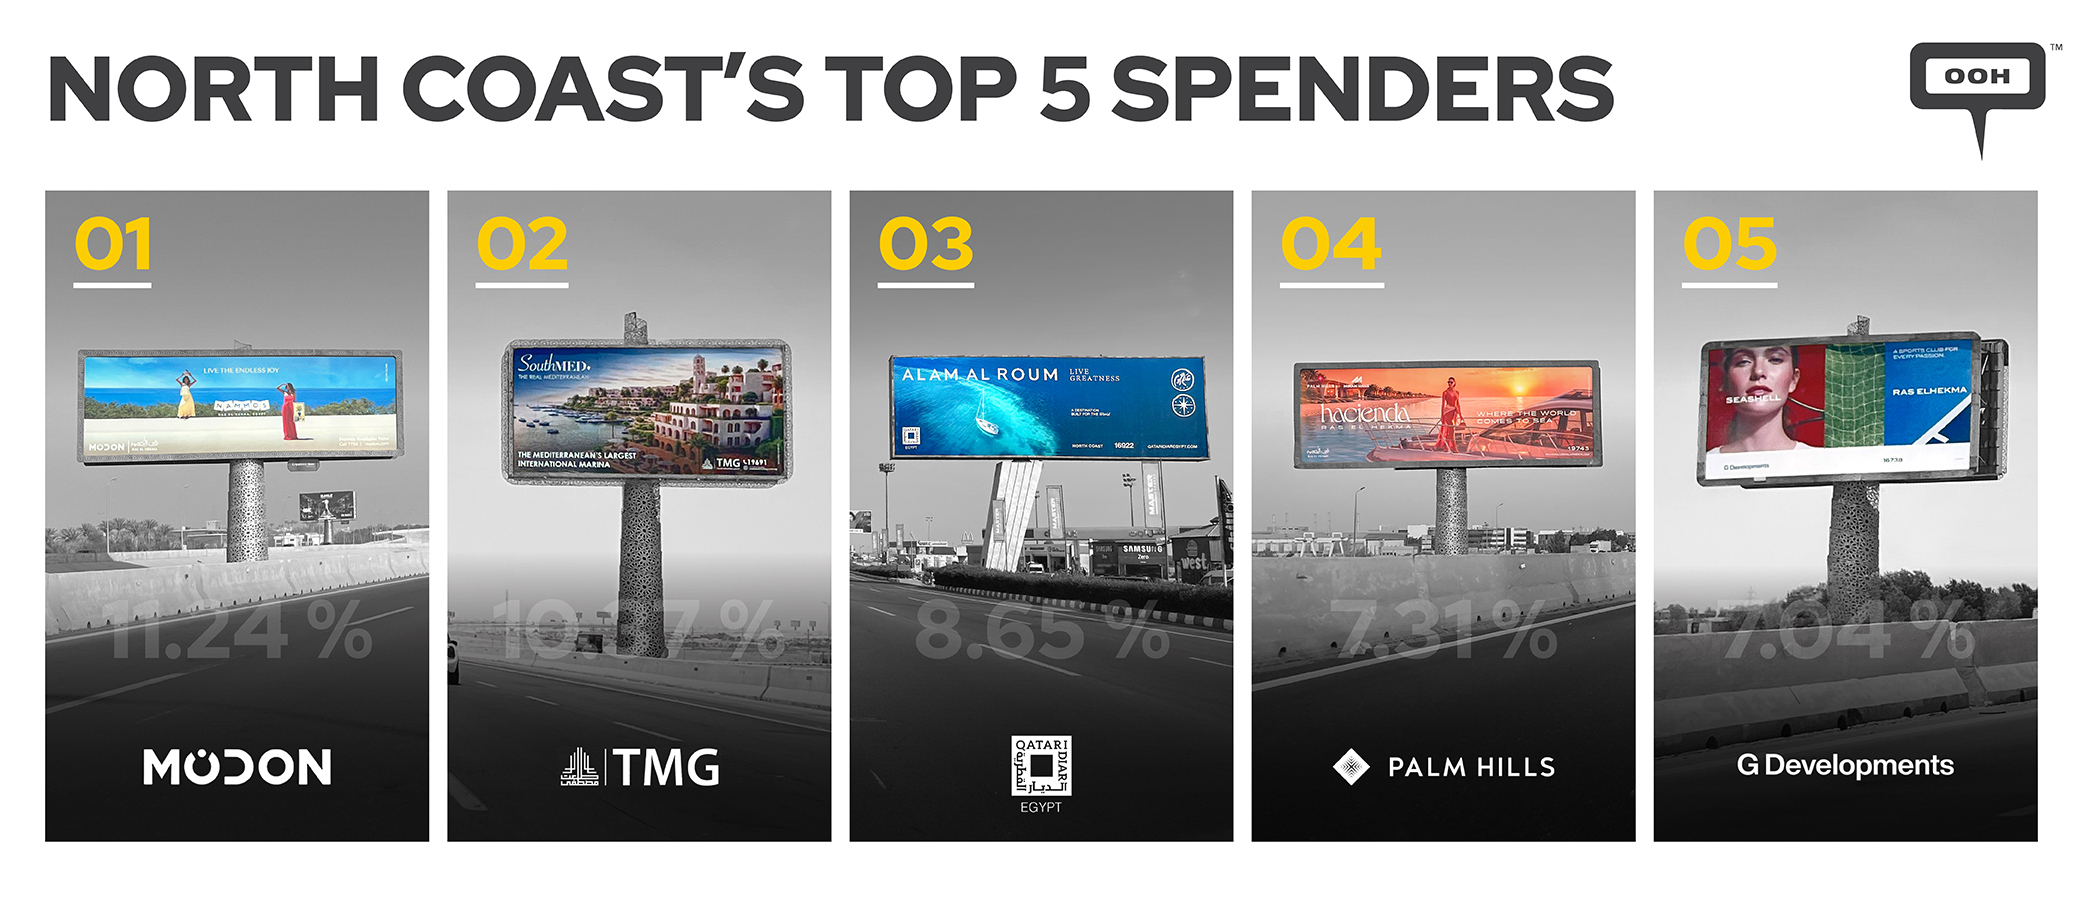
Modon Holding led the North Coast’s top five advertisers, accounting for 11.24% of real estate’s official-rate advertising value, followed by TMG Holding at 10.37%, Qatari Diar at 8.65%, Palm Hills Development at 7.31% and G Developments at 7.04%. Together, they represented 44.6% of real estate value, equivalent to 35.3% of the total monitored market.
Beyond property, Equity Real Estate Development led Hospitality with 50.3% of sector value, followed by Yalla Sahel at 13.8%, bringing their combined share to 64.1%. Equity’s Waterway North Coast campaign is classified under hospitality by MOOH. In Finance & Investment, Suez Canal Bank held 39.7%, while Thndr, recorded under Axis Markets B.V., contributed 17.3%, together accounting for 57.0%.
Concentration was particularly pronounced in Healthcare, where Majestic Biopharma accounted for 86.4% and ElEzaby Pharmacies supplied the remaining 13.6%. In Telecommunications, Vodafone Egypt held 81.6%, followed by Etisalat by e& at 9.0%. Automotive was led by Kasrawy Group with 36.2%, ahead of Nissan Motor Egypt at 24.4%. These shares show how a small number of advertisers shaped activity within each sector.
These concentrations matter when interpreting growth: substantial commitments from individual advertisers can reshape an entire category’s annual performance.
Static Formats Dominate Physical Inventory
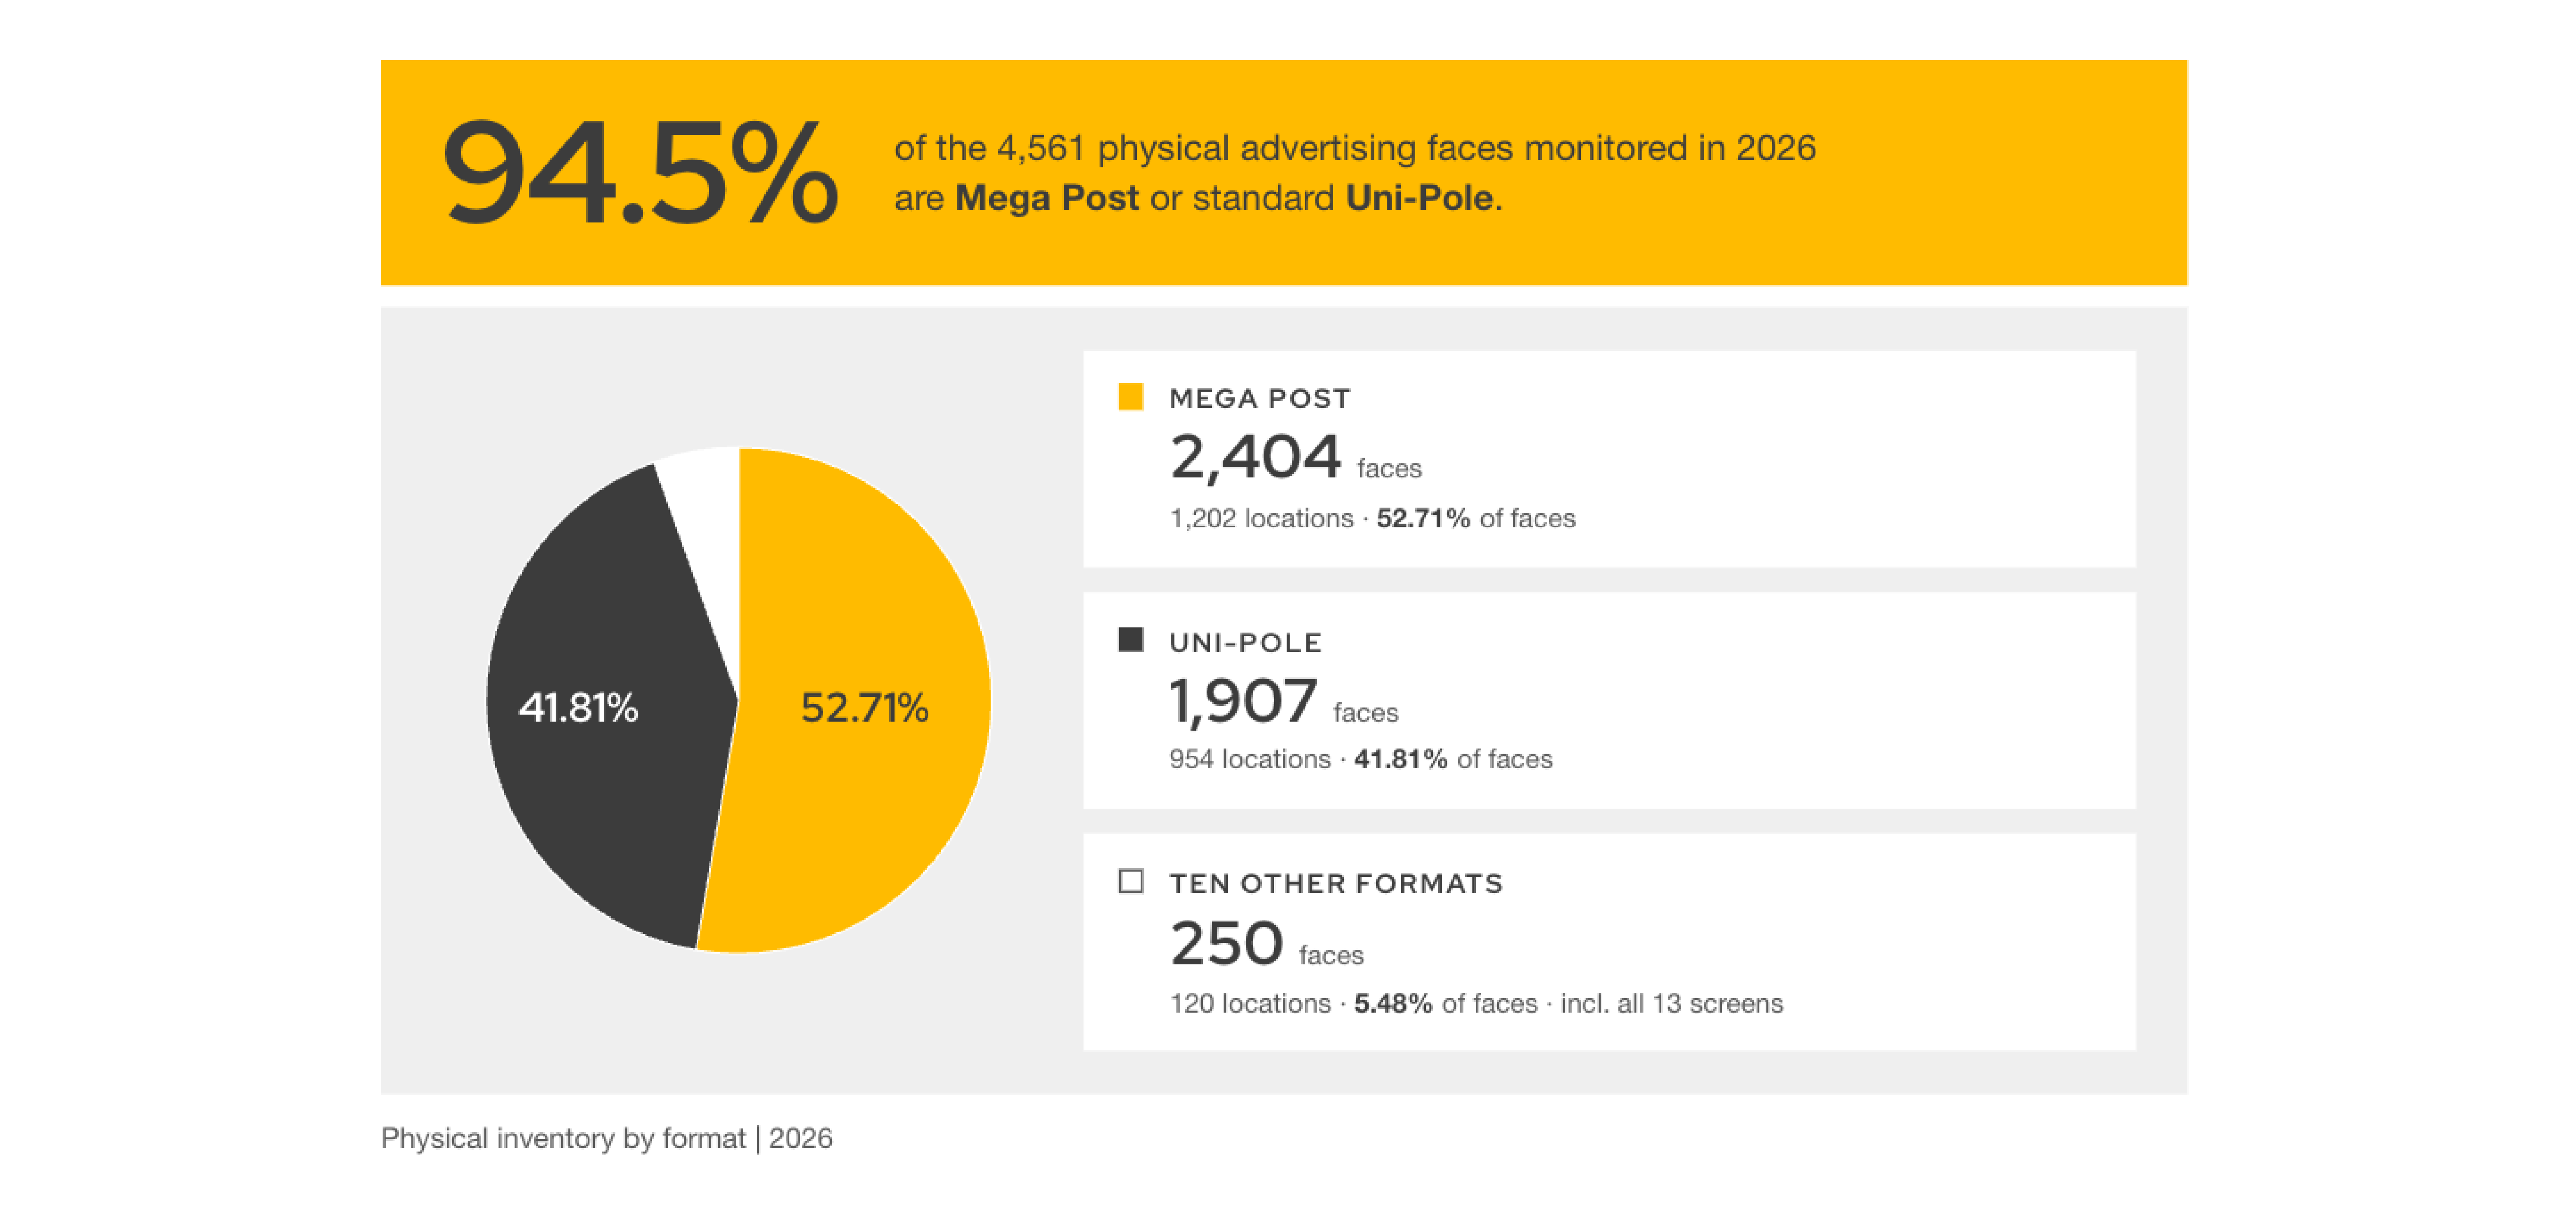
The monitored inventory comprised 2,276 locations carrying 4,561 physical faces, including 4,548 static faces and 13 digital screen faces.
Mega Post accounted for 2,404 faces, or 52.71%, while standard Uni-Pole supplied 1,907, or 41.81%. Together, they represented 94.5% of inventory. Ten other formats contributed the remaining 250 faces.
Digital screens occupied nine locations and represented only 0.29% of physical faces. Their campaign participation was considerably greater than this inventory share suggests.
DOOH Reaches One in Five Campaigns
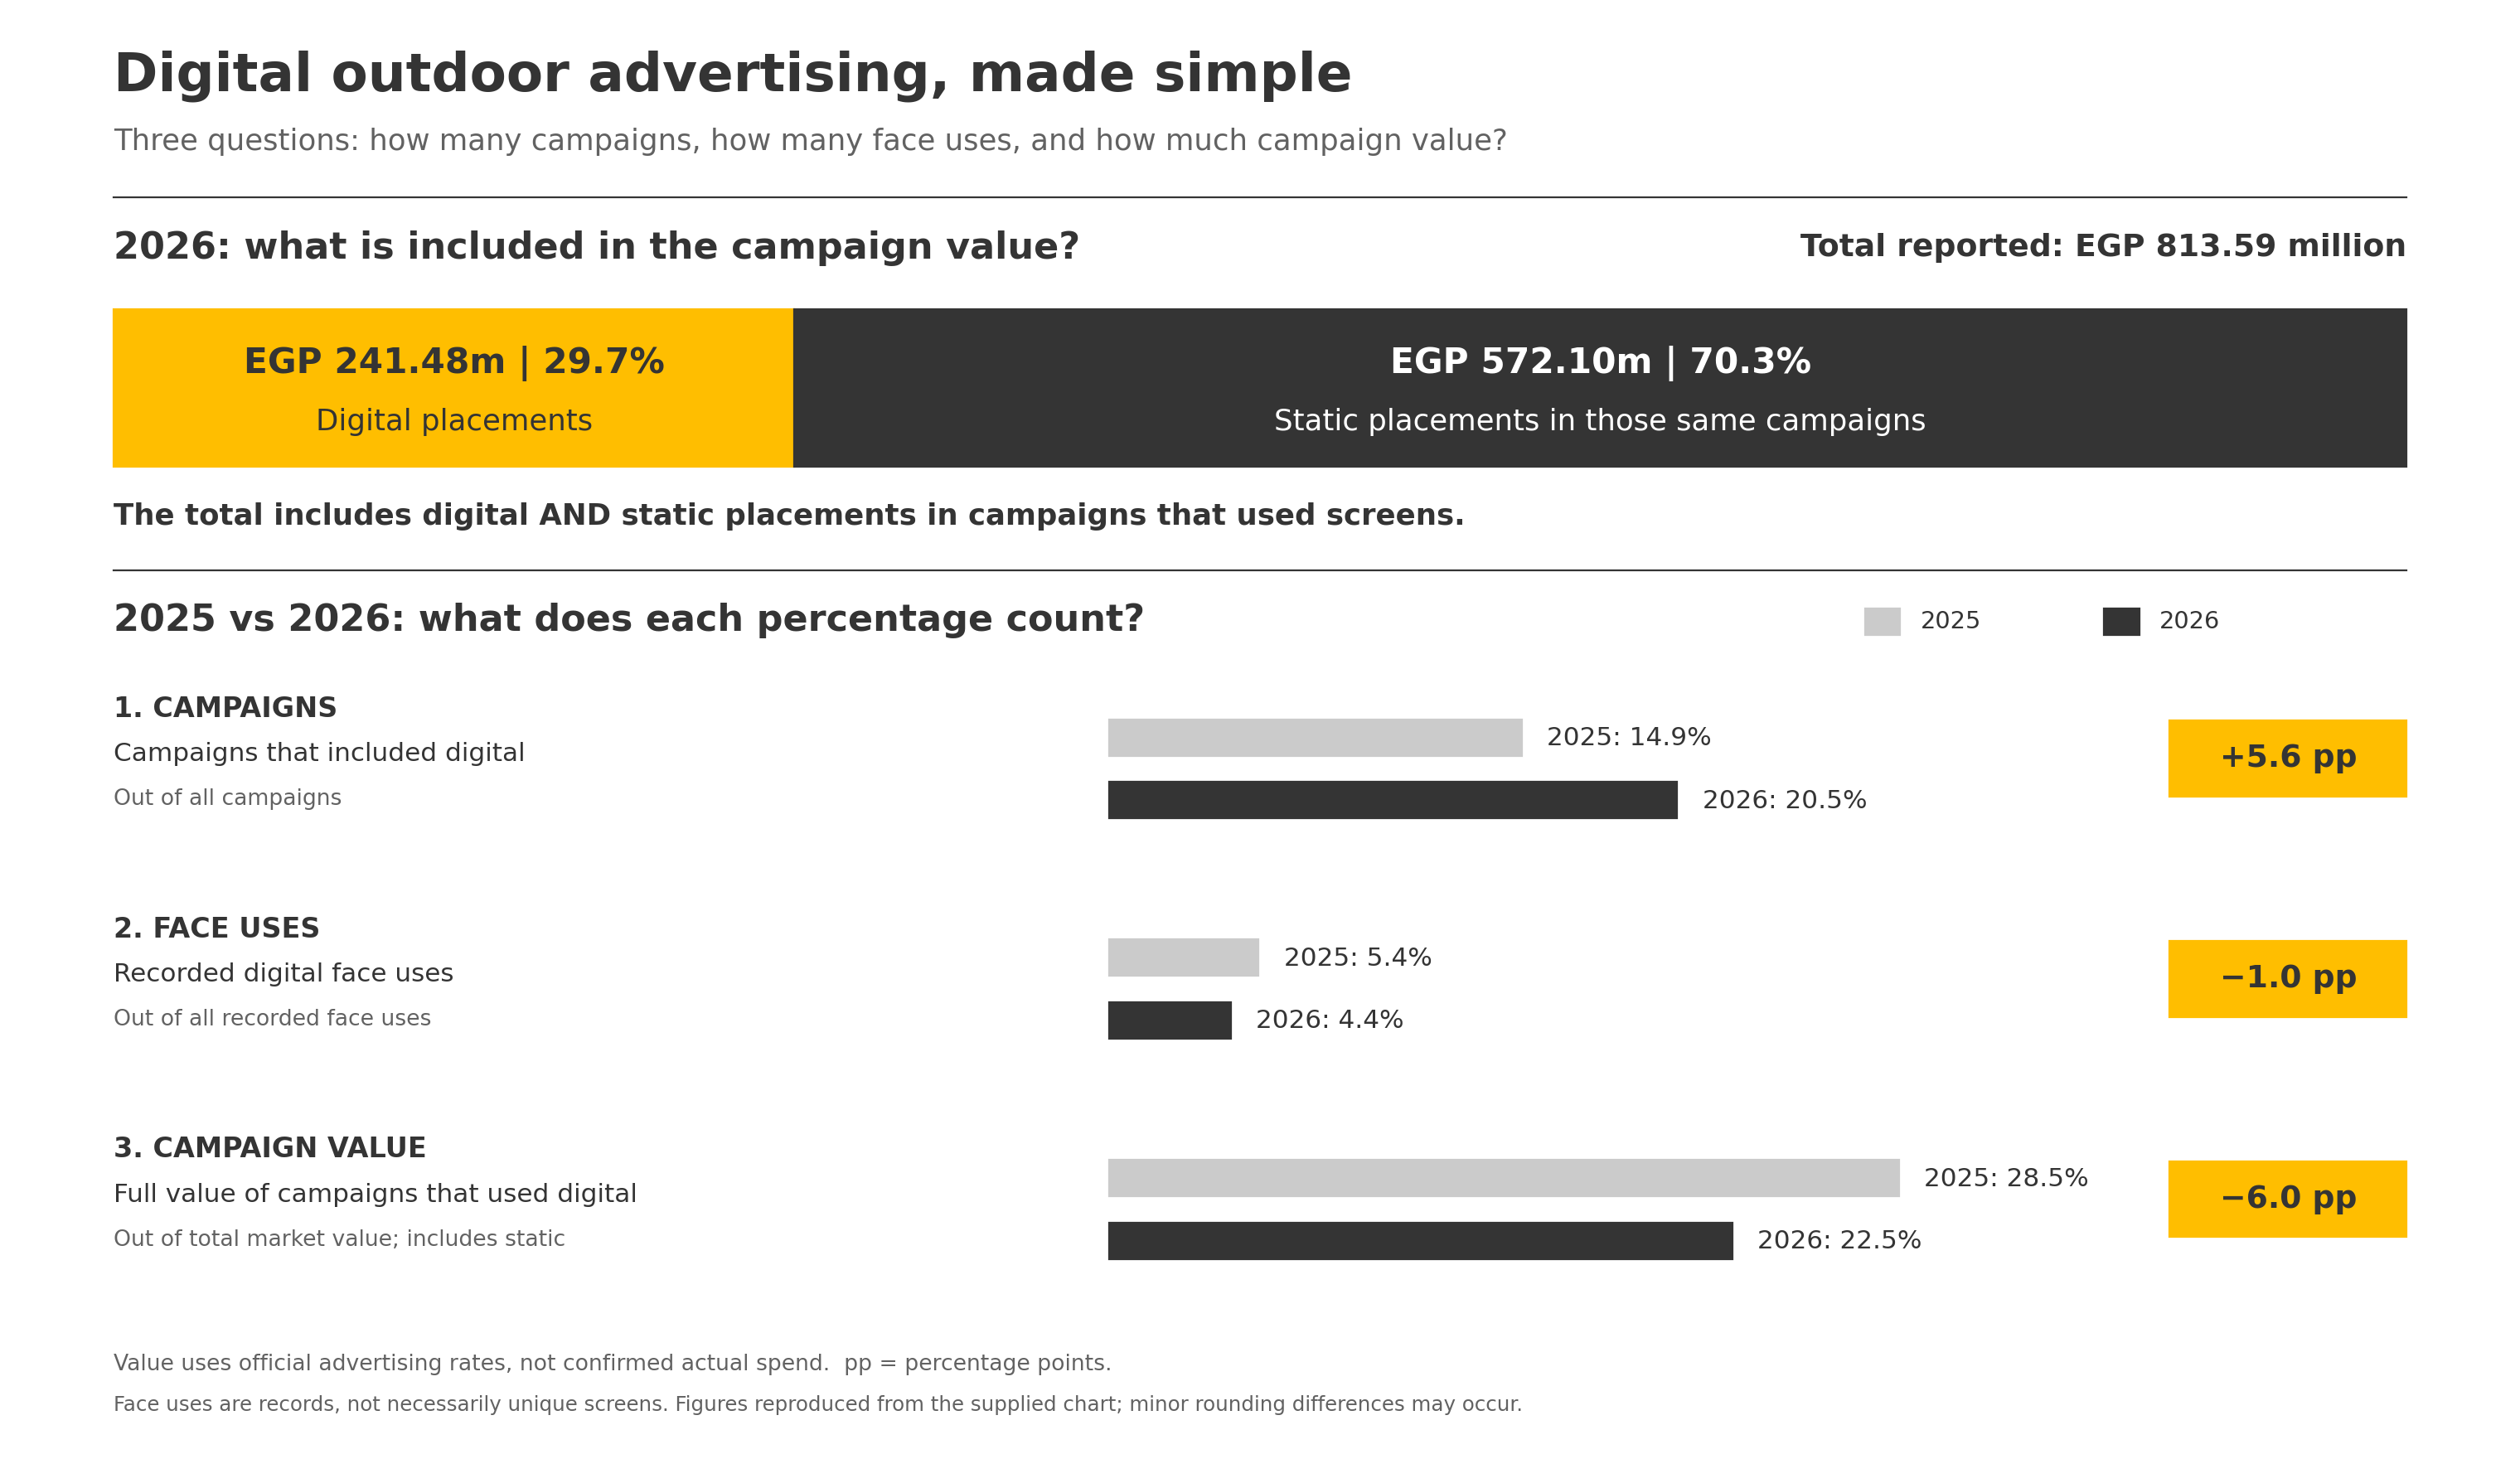
Campaigns using digital screens increased 52.9%, from 17 to 26. Their share rose from 14.9% to 20.5%, reaching approximately one campaign in five.
Digital-only campaigns increased from five to 12, while mixed static and digital campaigns rose from 12 to 14. Static-only campaigns increased from 97 to 101.
Direct DOOH fees totalled EGP 241.48 million, or 6.67% of market value. Campaigns using screens generated EGP 813.59 million across all their media, including approximately EGP 572.10 million from static placements.
Digital face-use records grew 13.5%, but their share fell from 5.4% to 4.4% as static activity expanded faster. More campaigns adopted screens, although this does not establish greater audience exposure or effectiveness.
Approach Roads Gain Importance
The International Coastal Road retained 78.8% of face-use records, down from 82.5%, despite activity increasing 32.2% to 9,162 records.
Wadi El Natrun–Alamein records nearly doubled to 1,400, lifting its share from approximately 8.3% to 12.0%. Cairo–Alexandria increased 39.3% to 1,067 records, maintaining approximately 9.2%.
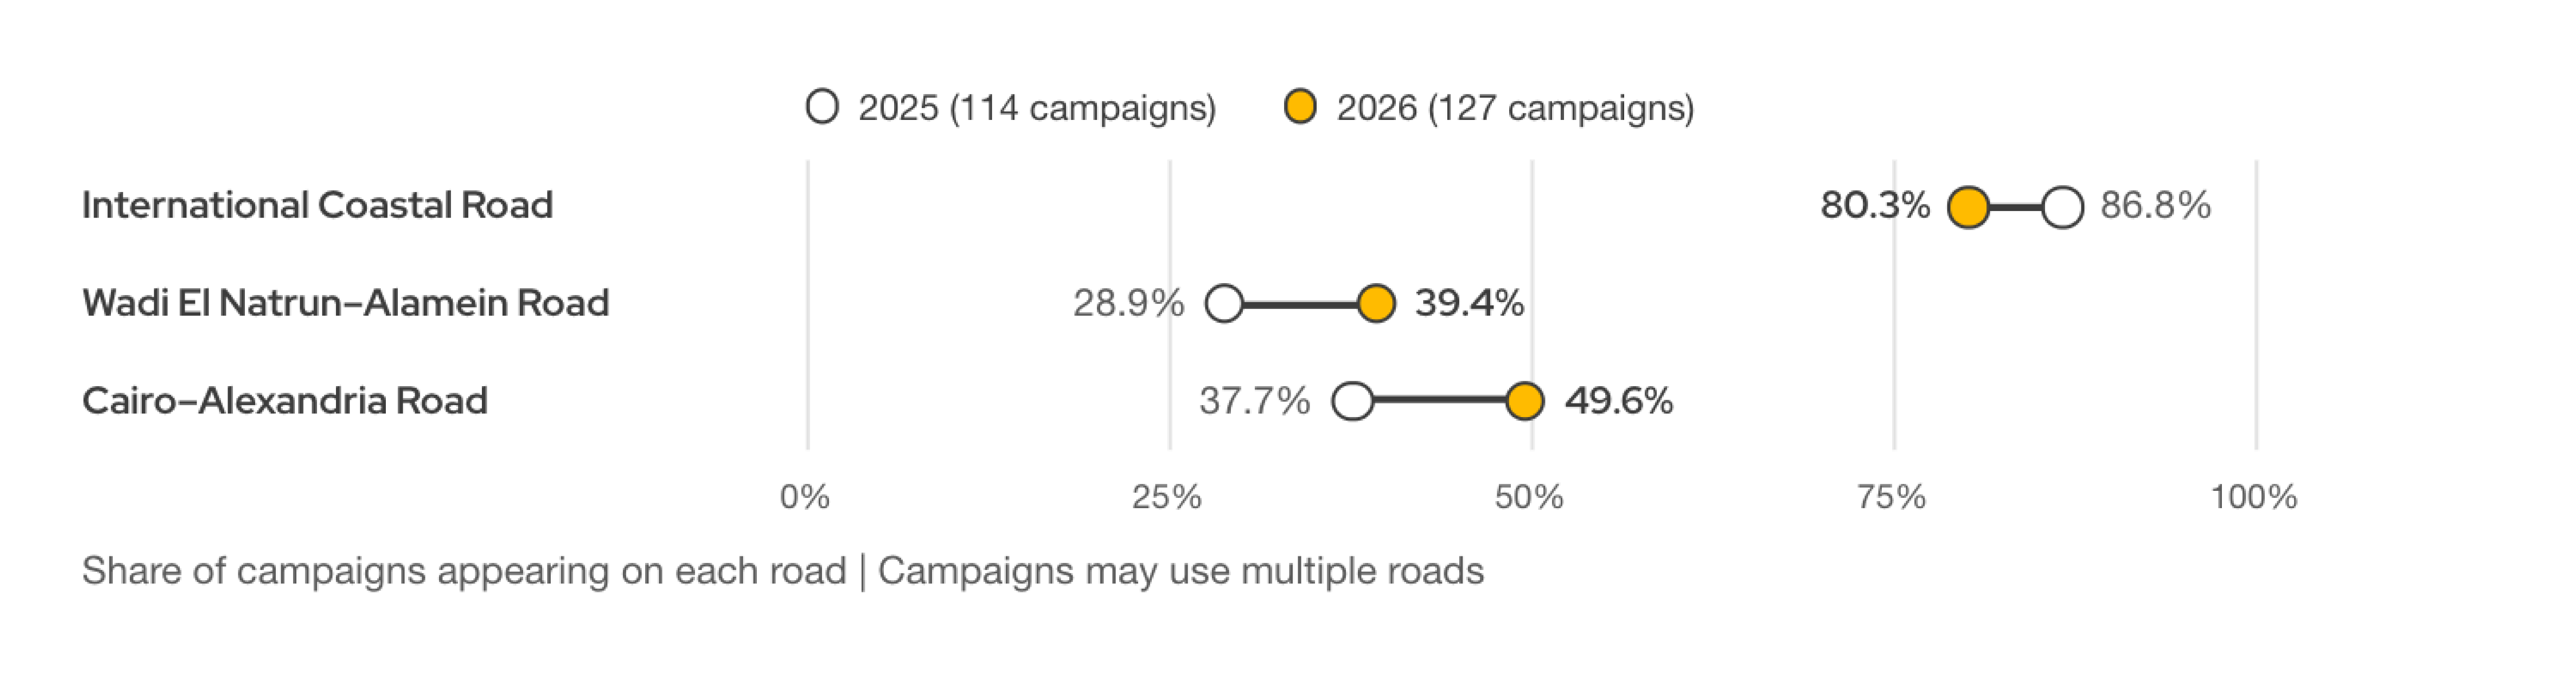
Campaigns using multiple roads increased from 40 to 60, raising their share from 35.1% to 47.2%. Almost half the season’s campaigns therefore extended across several routes, strengthening the approach roads’ role in reaching travellers before arrival.
The geographical shift also appeared in campaign counts. Wadi El Natrun–Alamein carried 50 campaigns, compared with 33 previously, while Cairo–Alexandria increased from 43 to 63. The International Coastal Road rose from 99 to 102. These counts overlap because campaigns can use several roads, reinforcing the importance of separating route participation from the total number of campaigns.
What the Numbers Reveal About Sahel’s OOH Market
The findings point to a larger market with broader participation and geographical coverage. Property continued to determine overall scale, while hospitality and selected emerging categories added variety. Road selection, advertiser concentration and the distinct roles of static and digital media remain central to understanding the next season’s opportunities.
The 2026 season was not simply bigger. It reached further along the journey, while its value stayed concentrated in a handful of property names.
From market direction to campaign detail
This article draws on the headline indicators of MOOH's North Coast monitoring. MOOH's detailed paid report provides deeper analysis of advertiser spending, campaign performance, format trends and road-by-road activity across both seasons. Explore the report by contacting ✉️ MOOH to request access.
Source and methodology. Field monitoring by MOOH Media Intelligence, July–September 2026 and 2025 of defined study segments on three roads. Spending figures are valuations at official media rates before negotiation, discounts and offers, including production, printing and 14% VAT; they are not negotiated expenditure or media-owner revenue. Face-use records count faces appearing within campaigns and monitoring months and are distinct from physical inventory. Physical inventory follows MOOH's latest 2026 tables. 2026 use totals follow detailed records after duplicate removal, retaining the 2025 comparison basis. Sector and advertiser figures follow MOOH's campaign classifications. Advertiser figures are shown as a share of sector value and of total market value (EGP 3.621bn). Displayed values are rounded; calculations use unrounded values.
Come on, tell us what you feel about this article.

Learn about this campaign budget, media plan, campaign data